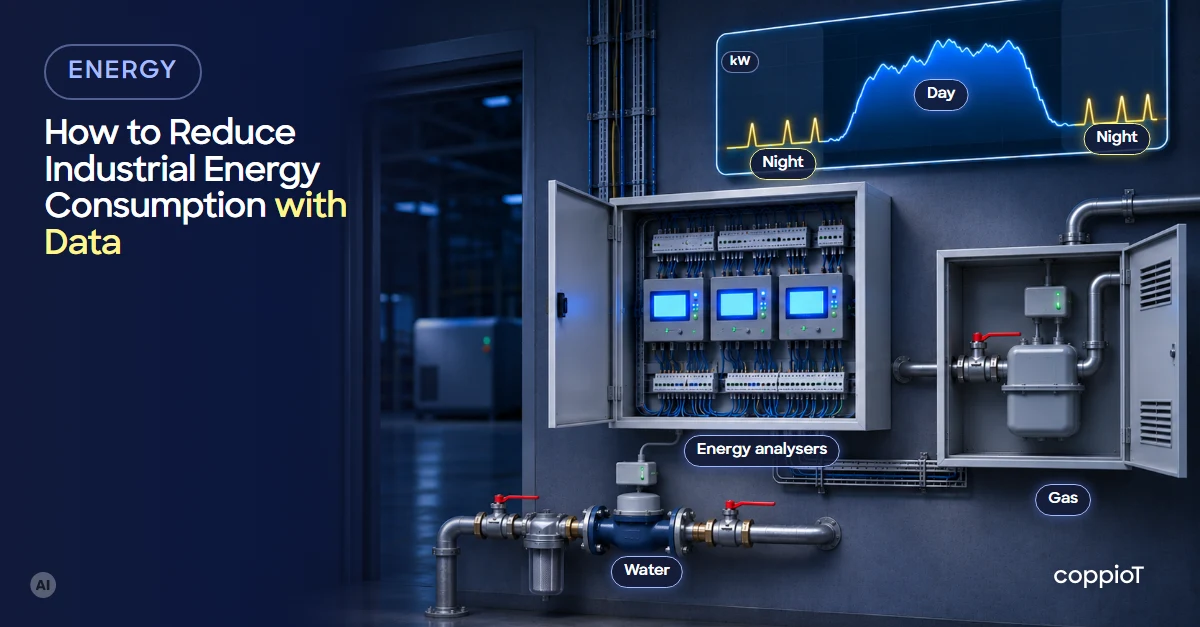
To reduce industrial energy consumption, you first need to know where the energy goes and when. With the plant’s meters connected you get a baseline, and on top of it the losses the bill doesn’t show appear: machines running without producing, compressors starting at night, worn equipment with extra friction, power peaks and loads in the most expensive hours. Then you act on what weighs most and check with the same data whether the savings are real.
Why isn’t the energy bill enough?
The bill tells you how much you spent in the month, but not which machine, which shift or which hour. It tells you that you spent more this month, but not why. And without knowing why, any saving measure is a gamble.
Industrial energy efficiency starts with measuring: an energy meter or analyser per area or per major machine, read every few seconds and stored with its date and time. Where to put them and how to connect them is explained in energy monitoring in manufacturing.
How do you reduce energy consumption step by step?
- Start with the big items and get the baseline. First the resource that weighs most on the bill; then its areas and its machines. With two or three weeks of data you already see how much each area uses on a normal day, at a weekend and per part you make. It’s the reference you’ll compare everything else with.
- Look for what’s spent without producing, or in excess. Equipment running with no work, leaks and worn machines: it’s the first thing that shows up and usually the cheapest to fix.
- Look at peaks and hours. When you consume matters almost as much as how much.
- Add water, gas and compressed air. Electricity isn’t the only resource that leaks away.
- Act on what weighs most and leave the rest for later.
- Check the savings with the same meters, before and after.
Where is energy lost without producing?
In almost every plant, in the same places:
- Machines running between shifts and at weekends: ovens, extractors, pumps and lighting nobody switches off.
- Compressed air: leaks make the compressor work while the plant is stopped. If it starts at night, the curve shows it before a walk round the plant does. According to the US Department of Energy’s compressed air guide, in a plant that hasn’t been well maintained leaks are typically 20% of the compressor’s output, and sometimes reach 20-30%; with a leak detection and repair programme they drop below 10% (Fact Sheet 7, leaks, May 2026).
- Equipment that never stops: a chiller running all weekend, a pump moving water nobody uses.
How to measure idle consumption and the other indicators is covered in real-time energy monitoring: 5 KPIs to track.
Why does a worn machine use more energy?
Because it does the same work with more friction, and the energy lost to friction is paid for just like the useful energy: it ends up as heat.
- Slipping belts: according to the US Department of Energy tip sheet on belt drives, a V-belt drive can reach 95% efficiency or more when installed, and its efficiency can drop by as much as 5% over time if the belt slips because it isn’t retensioned.
- Badly lubricated bearings and gears: with too little grease, dirty grease or too much grease, a bearing has more friction and runs hotter. And lubrication breakdown is the usual cause of bearing failure. How much extra energy it costs depends on the machine: there’s no reliable general figure, so the best way to know is to measure before and after greasing.
- Worn motors and pumps: a motor that uses more than its twin on the other line, or more than a few months ago for the same production, is telling you something is rubbing, slipping or out of alignment.
With the consumption of each major machine measured separately, that wear shows up in the curve before it turns into a breakdown. And after greasing, retensioning the belt or repairing, the same curve tells you whether consumption is back to its normal level.
How do peaks and hours help you spend less?
- Power peaks: if several large loads start at the same time, you get close to your contracted power or exceed it, and the excess is charged. With real-time power you can stagger the starts and, with a few months of history, know whether your contracted power is too high or too low.
- Expensive hours: electricity doesn’t cost the same at every hour. If a process doesn’t depend on the shift, such as filling a tank or preheating an oven, moving it to the cheapest hours saves money even if it doesn’t save kWh.
Why measure water, gas and air too?
Because losses hide between resources. A badly tuned gas oven, a water circuit that never stops or a compressor working too hard don’t show up on the main electricity meter.
With every resource in the same system you can cross them with production: how many kWh, cubic metres of water or gas each part, batch or shift costs. And if the plant has solar panels or batteries, you see what they generate next to what you consume, instead of opening a different app for each one.
How do you know the savings are real?
By comparing with the baseline, under similar conditions: the same production, the same season. If the compressor stops starting at night after you fix the air leaks, the curve shows it the next day. If you stagger the starts, you see whether the peak drops below your contracted power.
Measuring doesn’t save anything by itself: the changes you make with the data do. But without data you don’t know which one to make first, or whether it worked.
What does the regulation say?
- In the EU, from now on: Directive (EU) 2023/1791 on energy efficiency moves the criterion from company size to energy use (Article 11). Above 10 TJ (terajoules) a year on average (about 2.8 GWh), an energy audit every four years, the first by 11 October 2026, unless the company has an energy management system. Above 85 TJ (about 23.6 GWh), a certified energy management system, for example under ISO 50001, by 11 October 2027. Member States had to transpose it by 11 October 2025 (Article 36).
- In Spain today: Royal Decree 56/2016 requires large companies (at least 250 people, or more than €50 million turnover and more than €43 million balance sheet) to carry out an energy audit every four years covering at least 85% of their consumption (Articles 2 and 3). A certified energy management system that includes that audit can replace it. As of this article, its consolidated text on the BOE doesn’t yet reflect the directive’s change.
Either way, having consumption measured and stored makes the audit much easier, and an energy management system needs that continuous measurement.
How we do it with coppioT
coppioT is engapplic’s no-code industrial IoT¹ platform: it connects energy analysers, water and gas meters, PLCs², controllers and other devices from several brands into a single data system, with no programming needed. The infrastructure is built on AWS, in the region you choose.
- Make use of the meters you already have, whatever the brand, as long as they have some output: pulses, Modbus RTU or TCP, OPC UA³ or an analog signal. If they have none, a communication module is added or a new meter is fitted. If your device uses another protocol, tell us and we’ll look at how to read it.
- Start with the overall figure and grow: first total consumption and the large areas; then the machines that weigh most.
- Your charts and reports, in the tools you already know: Grafana or Power BI, with the baseline, idle consumption, peaks and the alerts you need.
If you’re an integrator, you create one project per customer and see them all from the same coppioT; each customer logs into theirs and sees only their data.
It’s what we did on the paint booth we have connected at a RACC-AXA workshop in Barcelona, with the integrator Sinnek: the customer sees what diesel or LPG⁴ and electricity cost them, per part and per hour.
We start with a short, fixed-price consultancy with engapplic, and a pilot before scaling. All of it in days, not months: up to 90% faster than building it by hand.
Frequently asked questions
Where do I start reducing energy consumption?
With what weighs most on the bill, from big to small. If you pay €10,000 a month for electricity and €500 for water, start with electricity: first the overall consumption and the large areas; then the machines that use the most. The bill tells you where to look, but to act you need to measure: only then do you know which machine, which shift and which hour to change.
Do I have to replace my meters?
Not necessarily. If they already have communication (Modbus, for example) or a pulse output, they’re read as they are. If they have no output at all, many accept a communication module. Replacing them is the last option, and it’s often better to fit a new one alongside than to swap it: that way you compare both readings and, once the new one measures steadily, you remove the old one.
Can the data show that a machine is worn?
Yes, if you measure its consumption separately. If it uses more than its twin, or more than a few months ago, for the same production, something is rubbing, slipping or leaking. After greasing, retensioning the belt or repairing, the curve tells you whether it’s back to its normal level.
How much can I save?
It depends on the plant and on what you do with the data. The usual first finds are idle consumption and avoidable peaks; with the history you work out how much each one costs and decide what to fix first.
Want to know where your plant’s energy goes? Ask for a demo: fill in the form, tell us which meters you have and we’ll show you how to see them all together.
Acronyms
¹ IoT (Internet of Things): here, industrial equipment that sends its data to the cloud.
² PLC (Programmable Logic Controller): the controller that runs a machine or an installation.
³ OPC UA (Open Platform Communications Unified Architecture): an industrial communication standard for reading data from a PLC or other device securely.
⁴ LPG: liquefied petroleum gas.


