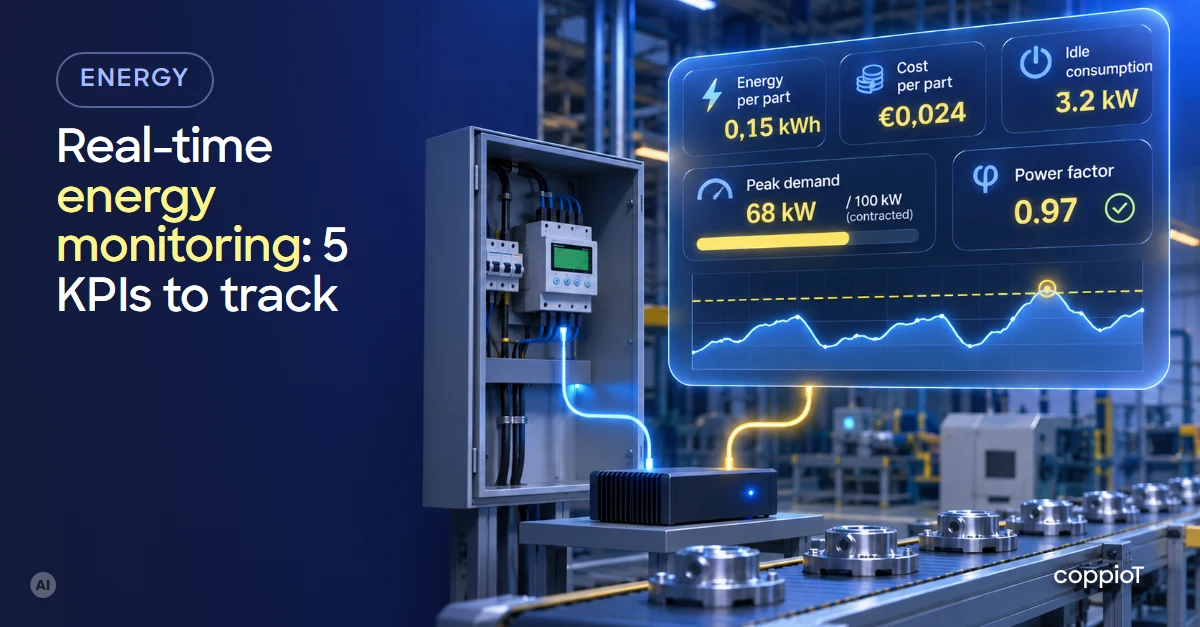
Energy consumption monitoring does little if you only look at total kWh. The KPIs¹ that actually help you spend less are five: energy per part, cost per hour and per part, idle consumption, peak demand against contracted capacity, and power factor. They all come from the same meters, read every few seconds and matched with what the plant produces.
Why the energy bill isn’t enough
The bill tells you how much you spent last month. It doesn’t tell you which machine, which shift or why. For that you need to meter by area, line or machine, with a reading every few seconds or minutes, and keep the history.
But a consumption curve isn’t enough either. A kWh chart that goes up and down doesn’t tell you whether the plant is doing well, because consumption also rises when you produce more. That’s why the ISO² 50001 energy management standard talks about energy performance indicators (EnPIs³) and an energy baseline: consumption is compared with what was produced, not with itself.
The 5 energy KPIs worth tracking
| KPI | What it tells you | Where it comes from |
|---|---|---|
| Energy per part | How much energy each good part costs | Energy meter + part counter |
| Cost per hour and per part | How much money production costs | The above + the price of each energy |
| Idle consumption | What you spend without producing | Energy meter + machine state |
| Peak demand | Whether you’re close to contracted capacity | Average power every 15 minutes |
| Power factor | Whether you pay for reactive energy | Power analyser |
1. Energy per part (specific energy consumption)
This is the main KPI: kWh per part, per tonne or per metre, depending on what you make. Illustrative example: a line uses 1,200 kWh in a shift and makes 8,000 good parts, which is 0.15 kWh per part. If the next shift uses the same energy but makes 6,000 parts, energy per part rises to 0.20 kWh, 33% more, and the day’s bill won’t show it.
To calculate it you need two figures that usually live in different places: the energy meter in the electrical panel and the part counter in the machine’s PLC⁴.
2. Cost per hour and per part
Turning kWh into euros changes the conversation: production and management understand cost, not kWh. And on many machines electricity isn’t the only energy. On the paint booth we have connected at a RACC-AXA car workshop in Barcelona, built with the integrator Sinnek, the customer sees what the diesel or LPG⁵ and the electricity cost, the cost per part and per hour, and a cost projection.
3. Idle consumption
This is what a machine uses while it’s on but not producing: during breaks, shift changes, at night or at the weekend. Compressors, ovens, extraction fans and hydraulic units left running are the usual suspects. To measure it, consumption is matched with the machine’s state (running or stopped), so you can see how much energy made no parts at all.
Compressed air is a classic. According to a US Department of Energy tip sheet on compressed air leaks, leaks often waste as much as 20–30% of a compressor’s output. A compressor that starts at night, with the plant stopped, is the clue: it shows in the curve before it shows on a walk round the plant.
4. Peak demand against contracted capacity
Contracted capacity is paid for whether you use it or not, and most utilities charge extra when you exceed it. In Spain, for example, the excess is billed for each tariff period, measured by a maximum-demand meter or every quarter hour, with a penalty formula that makes it considerably more expensive (Circular 3/2020 of the National Markets and Competition Commission, article 9.4). With power in real time you see when you’re getting close to the limit and can stagger the start of large loads. With a few months of history you’ll also know whether your contracted capacity is too high or too low.
5. Power factor
Motors and transformers draw reactive energy, which does no useful work. When the power factor (cos φ) falls too low, reactive energy is billed. In Spain, the excess is billed when reactive energy exceeds 33% of active energy, which is roughly a power factor below 0.95, depending on the tariff period (same circular, article 9.5). A power analyser measures it continuously: if a capacitor bank fails, you notice in days, not on the bill two months later.
How real-time energy monitoring works with IIoT
- Energy meters or power analysers on the main panel and on the lines or machines that use the most. Most have a Modbus⁶ output (RTU over a serial line or TCP over Ethernet); the simplest ones have a pulse output.
- An edge gateway that reads them every few seconds, together with the machine signals (running, parts) its PLC already has.
- A cloud platform that stores the history, calculates the KPIs and alerts you when something is out of the ordinary.
- A dashboard by plant, line and shift that people actually look at. We cover that in industrial dashboards that actually get used.
Start by measuring, not acting. Two or three weeks of data already show where the idle consumption and the peaks are, so you can decide with facts what to fix first. Where to put the meters and how to connect them is in energy monitoring in manufacturing.
How we do it with coppioT
coppioT is engapplic’s no-code industrial IoT⁷ platform: it connects machines, meters and other equipment of any brand to the cloud, with no programming. In energy, its strength is bringing everything into one data system: the building meters, solar panels and batteries usually each come with their own app, and coppioT joins them so you can match their data with production.
- We choose the metering points: which meters and which machine signals your KPIs need.
- We connect them over Modbus RTU or TCP, OPC UA⁸ or pulses, through a gateway whose installation files coppioT generates. If needed, our gateway, available on request, reads the pulses and analogue inputs.
- We build the dashboard with you in Grafana or Power BI, with energy per part, cost, idle consumption and peaks, plus the alerts you need.
All of that in days, not months: up to 90% faster than building it by hand. We start with a short consultancy at a fixed price with engapplic and a pilot before scaling. If you want to connect the meters yourself, see how they’re read in Modbus TCP vs OPC UA.
Frequently asked questions
What energy KPIs are used in manufacturing?
The most useful are energy per unit produced (kWh per part or per tonne), cost per hour and per part, idle consumption, peak demand against contracted capacity, and power factor. ISO 50001 calls them energy performance indicators.
How do you calculate energy per part?
Divide the kWh used in a period (a shift, a batch) by the good parts made in that same period. To do it in real time, you read the energy meter and the machine’s part counter at the same time.
Which meters do I need to monitor power consumption with IIoT?
Meters or power analysers with communication, usually Modbus RTU or TCP, on the main panel and on the lines or machines that use the most. Pulse-output meters work too, although they only give energy, not power, voltage or power factor.
How much can energy monitoring save?
It depends on the plant and on what you do with the data: metering alone saves nothing. What usually shows up first is idle consumption (machines and compressors running without producing) and avoidable peaks; with the history, you can work out what each one costs and decide what to fix first.
Want to see your plant’s energy per part in real time? Ask for a demo: fill in the form and we’ll show you how it would look with your meters and machines.
Acronyms
¹ KPI (Key Performance Indicator): a number that tells you whether a process is going well, compared with a target or with its own history.
² ISO (International Organization for Standardization): publishes standards such as ISO 50001, for energy management systems.
³ EnPI (Energy Performance Indicator): measures energy use against what is produced, for example kWh per part.
⁴ PLC (Programmable Logic Controller): the controller that runs the machine; for example, a Siemens S7 or a Beckhoff.
⁵ LPG (Liquefied Petroleum Gas): propane or butane, a common fuel for burners and paint booths.
⁶ Modbus: a simple, widespread industrial protocol (RTU over a serial line, TCP over Ethernet). Data is read from numbered registers, following the map the device maker provides.
⁷ IoT (Internet of Things): industrial IoT (IIoT) connects machines and plant equipment to collect their data and use it.
⁸ OPC UA (Open Platform Communications Unified Architecture): an industrial communication standard to read data from a PLC or other device securely, with its name and type.


