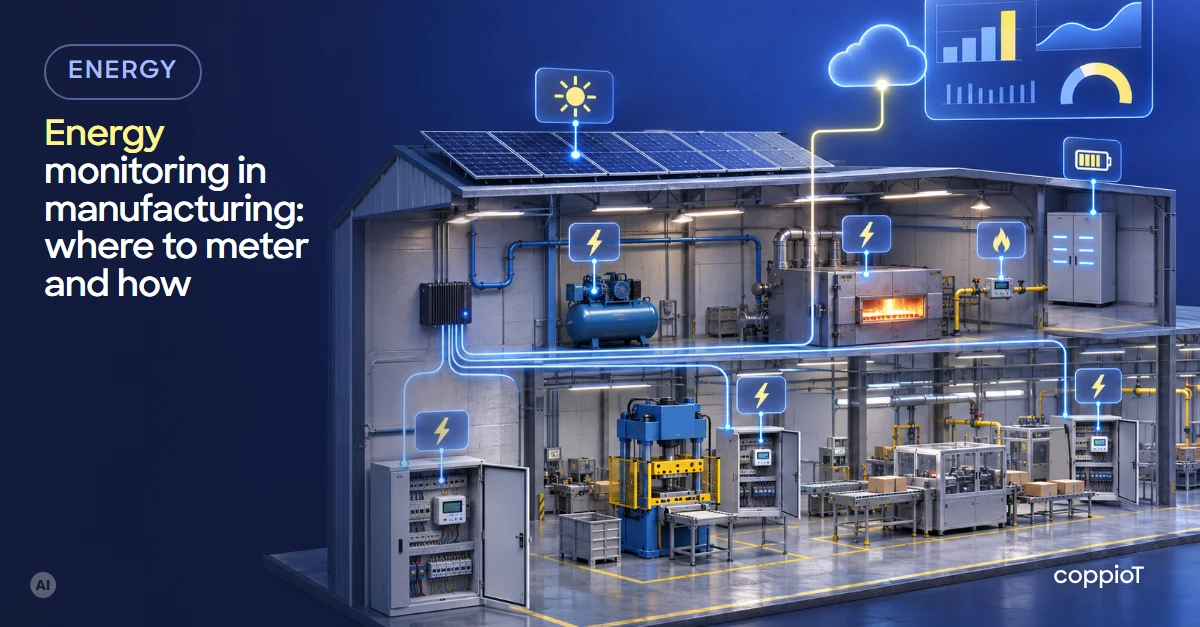
Energy monitoring in manufacturing means measuring energy by area, line and machine every few seconds, keeping the history and matching it with what the plant produces. Setting it up takes three things: deciding where to meter, fitting meters or power analysers with communication at those points, and a gateway that reads them and sends the data to the cloud. Many plants already have some of the meters; what they lack is reading them.
What is energy monitoring in a factory?
The utility bill gives one figure for the whole plant, once a month. Energy monitoring breaks it down: how much each area, each line and each large machine uses, minute by minute, and what state the machine was in while it used it.
With that breakdown you can answer what the bill can’t: which line uses most per part, what stays on at night, when in the day you get close to your contracted capacity. The indicators worth getting from that data are in 5 energy KPIs¹ to track. Here we go one step earlier: how to set it up.
Where should you meter?
You don’t need a meter on every machine on day one. Metering goes in levels, starting at the top and going down where the large loads are:
| Level | Where it goes | What it tells you |
|---|---|---|
| 1. Whole plant | Main switchboard, at the incomer | Total consumption, peaks against contracted capacity and the base load with the plant stopped |
| 2. Areas or lines | Sub-distribution boards for each hall, line or service | Which part of the plant takes the energy, and in which shift |
| 3. Large loads | Compressors, ovens, chillers and HVAC², hydraulic units, injection moulding machines, presses | Each machine’s consumption and what it uses idle, without producing |
| 4. Other utilities | Gas, diesel, water, compressed air | The full cost, not just electricity |
| 5. Generation and storage | Solar panels, batteries | How much you generate, how much of it you use and how much you buy |
A rule of thumb: once the line meters and the large loads add up to almost everything the main meter reads, you have enough to start. The rest can wait until the data tells you where to look.
Which meters do you need?
- Power analyser: measures energy plus power, voltage, current and power factor on each phase. It’s the device for the main switchboard, sub-boards and large machines. Most have Modbus³ communication, over RTU (an RS-485⁴ serial line) or TCP (Ethernet).
- Energy meter with a pulse output: gives energy only, one pulse per so many kWh. Fine for secondary points or when it’s already installed.
- Split-core current transformers: they open and clip around the cable, without cutting it or disconnecting the machine for more than a few minutes. That’s how you add an analyser to a line that’s already running.
- Gas, diesel and water: meters with a pulse output or flow meters with a 4–20 mA output.
Before buying anything, check the cabinets: it’s very common to find power analysers already installed, with their Modbus port connected to nothing. To read them you need the maker’s register map, which says at which address each value sits (energy, power, voltage…). We explain how a Modbus device is read in Modbus TCP vs OPC UA.
How does the data get to the cloud?
- A gateway on the shop floor reads the analysers over Modbus RTU or TCP, counts the pulses and reads the 4–20 mA inputs, usually every few seconds.
- It also reads the machine: whether it’s running and how many parts it has made, from the PLC⁵ or from a signal in the cabinet. Without that you can’t calculate energy per part or idle consumption. If the machine is old, there are several ways to read it; we cover them in how to connect legacy machines to the cloud.
- It sends the data to the cloud. If the internet connection drops, it keeps the data for about 1 or 2 days and sends it when the connection is back.
- The platform organises the data like the plant: Factory › Hall 2 › Line 3 › Compressor. That’s what lets you add up by area, compare by shift and raise alerts.
What should you look at in the first weeks?
Two or three weeks of history already give you the first leads:
- The base load: what the main meter reads on a Sunday or at night with the plant stopped. If the stopped plant still uses a large share of what it uses when working, equipment is being left on.
- Equipment starting with no production: a compressor that starts every few minutes in the early hours usually means air leaks.
- Power peaks: at what time the large loads start together, and how close you get to your contracted capacity.
- Differences between shifts or lines: the same product with different energy per part.
An illustrative example: a plant that runs at about 400 kW reads 90 kW on a Sunday, with everything stopped. The breakdown shows that 35 kW is the compressor and 25 kW the HVAC in an empty hall. Those are two specific things to check, each with its cost per hour, instead of a vague “we use too much”.
Solar panels, batteries and meters in one system
In many plants each energy device comes with its own app: the solar inverter, the batteries, the utility meter. Each shows its own part and none of them matches its data with the others, or with production. Putting everything in one data system lets you see, on the same dashboard, how much you generate, how much you use, how much you buy and what each part costs.
How we do it with coppioT
coppioT is engapplic’s no-code industrial IoT⁶ platform: it connects energy analysers, PLCs, controllers and other equipment of any brand to the cloud, in one data system and with no programming.
- We choose the metering points with you: what you want to know, which meters you already have and which are missing.
- We connect them over Modbus RTU or TCP, OPC UA⁷, pulses or analogue inputs, through a gateway whose installation files coppioT generates. coppioT is compatible with any PC or industrial PC; if you prefer, our gateway, available on request, comes with analogue inputs and a pulse counter.
- We build the dashboard with you in Grafana or Power BI, with consumption by area and by machine, the base load, the peaks and the alerts you need.
That’s what we did on the paint booth we have connected at a RACC-AXA car workshop in Barcelona, with the integrator Sinnek: our gateway reads its pulses and analogue inputs, and the customer sees what the diesel or LPG⁸ and the electricity cost, and the cost per part and per hour.
All of that in days, not months: up to 90% faster than building it by hand. We start with a short consultancy at a fixed price with engapplic and a pilot before scaling.
Frequently asked questions
Can I use the meters I already have?
Almost always. If they have Modbus communication, they’re read with their register map; if they only have a pulse output, the pulses are counted. What can’t be read is a meter with no output at all: there you add an analyser with split-core current transformers.
How often is the data read?
Usually every few seconds. One reading a minute is enough to see energy, but power, start-ups and peaks show up better with more frequent readings.
Do you have to stop the plant to install the meters?
To read an analyser that’s already installed, no. Fitting a new one means working in the cabinet, usually a few minutes per point, during a short stop or a shift change.
Can gas or compressed air be measured too?
Yes, with meters that have a pulse output or flow meters with a 4–20 mA output, which the gateway reads together with the electricity.
Want to see where your plant’s energy goes? Ask for a demo: fill in the form, tell us which meters and machines you have and we’ll show you how it would look.
Acronyms
¹ KPI (Key Performance Indicator): a number that tells you whether a process is going well, compared with a target or with its history.
² HVAC (Heating, Ventilation and Air Conditioning): the building’s heating, ventilation and air conditioning.
³ Modbus: a simple, widespread industrial protocol (RTU over a serial line, TCP over Ethernet). Data is read from numbered registers, following the map the device maker provides.
⁴ RS-485: a serial line standard that is very common in industry; several devices can share the same pair of wires.
⁵ PLC (Programmable Logic Controller): the controller that runs the machine; for example, a Siemens S7 or a Beckhoff.
⁶ IoT (Internet of Things): industrial IoT (IIoT) connects machines and plant equipment to collect their data and use it.
⁷ OPC UA (Open Platform Communications Unified Architecture): an industrial communication standard to read data from a PLC or other device securely, with its name and type.
⁸ LPG (Liquefied Petroleum Gas): propane or butane, a common fuel for burners and paint booths.


