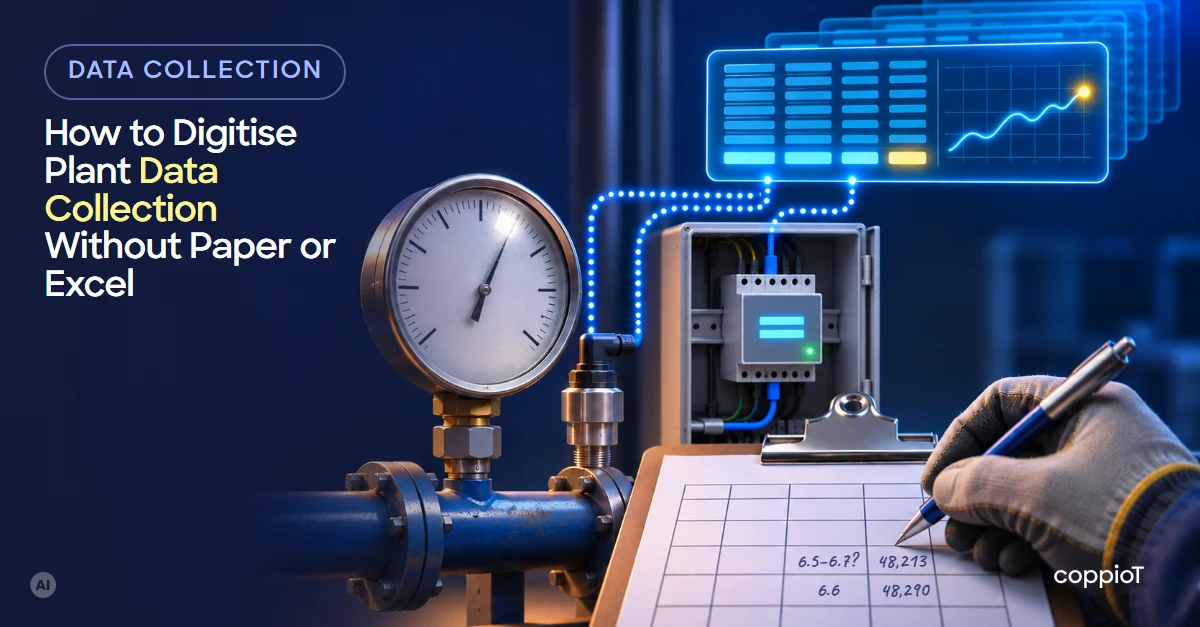
Almost everything a plant still writes down by hand (meter readings, compressor running hours, parts, stoppages, temperatures) already exists inside some device: the PLC¹, the energy meter or the machine itself. Digitising data collection means reading it from there automatically, storing it with its date and time, and organising it like the plant. You start with the data that costs the most time or drives the most decisions, on one or two machines.
What data is still written down by hand in a plant?
More than it seems. These are the usual ones, and where they can be read without anyone writing them down:
| Data | How it is recorded today | Where it can be read automatically |
|---|---|---|
| Electricity, gas or water readings | A weekly or monthly round, on paper | An energy meter in the panel, or the meter’s pulse output |
| Compressor running and load hours | Read off the machine’s screen | The compressor itself, if it has communication, or a meter in its panel |
| Parts produced and rejects | The shift report | The machine PLC’s counters |
| Stoppages | The shift report or a whiteboard | The PLC’s run/stop status; the operator still gives the reason |
| Process temperatures and pressures | A sheet on the round | The PLC, or a sensor on an analogue input |
| Chiller or fume extraction consumption | Hardly ever recorded | A meter in its panel |
The right-hand column is the point: in most cases the data is already there, it is just that nobody reads it.
What is wrong with writing it down by hand?
It is not only the time. Even a well-kept sheet has limits:
- It arrives late. You see the week’s consumption the following Monday, and a long stoppage at the end of the month.
- It is a snapshot, not a film. One reading a day does not show the 6 a.m. peak, or the compressor still running at the weekend when nobody is using air.
- It has errors and gaps. A number copied wrong, a round that did not happen during the holidays.
- It takes up people who could be doing other things. The technician on the round, and whoever types the data into Excel.
- It ends up scattered. The energy sheet, the production sheet and the maintenance log never meet, so the cost per part or per hour comes out of none of them.
What does digitising data collection mean?
It is not the same as automating. Automating means the machine does its job by itself, and its PLC already does that. Digitising data collection means reading what the machine and the installation already know, without touching how they work. It comes down to three things:
- Read the data at the source: from the PLC over OPC UA² or Modbus, from the energy meter, the pulse counter or a sensor.
- Store it with its date and time, in a history that does not get lost or depend on a spreadsheet.
- Organise it like the plant: Plant › Line › Machine, so anyone can find the data and lines or shifts can be compared.
With that in place, charts, reports and alerts follow. Reading the PLC does not change the machine’s logic. At most, the PLC’s communication is enabled or configured.
How do you move from paper to automatic data, step by step?
- List what is written down today, who records it and who uses it. Keep what drives decisions: if nobody looks at a figure, there is no need to read it.
- Find where each piece of data lives. The PLC, an energy meter, a meter with a pulse output, the equipment itself. Whatever is nowhere is solved with a new meter or sensor.
- Start with one or two machines, or with the compressor and the main panel. That is the pilot: within a few weeks you see whether the data is useful.
- Keep the sheet running in parallel for a few weeks and compare. That way people trust the automatic data before they stop writing it down.
- Scale in phases, line by line, starting with what the pilot showed was useful.
What changes when the data arrives by itself?
- Consumption shows up hour by hour and machine by machine. Idle consumption and the peaks the monthly reading hid come to light. Where to put the meters is in energy monitoring in manufacturing.
- OEE³ calculates itself, from the PLC’s stoppages and parts. We explain it in real-time OEE without spreadsheets.
- Alerts arrive when something happens, not at the end of the month: unusual consumption, a temperature going up.
- Data can be crossed: energy and production together give the cost per part and per hour.
- There is a history. With months of data you can take the next step, such as predictive maintenance.
What if the machine is old and has no communication?
It can still be read. A meter in its panel gives the consumption, and with it when the machine is running. Analogue inputs and pulse counters pick up simple sensors and meters. And equipment with a serial port is read through a gateway with RS-485⁴. The options, one by one, are in how to connect legacy machines to the cloud.
How we do it with coppioT
coppioT is engapplic’s no-code industrial IoT platform: it connects PLCs, energy meters and other equipment of any brand to the cloud, in one data system and with no programming needed. Today it reads OPC UA, Modbus RTU and TCP, analogue inputs and pulse counters, and if your equipment speaks another protocol, tell us and we will make it compatible.
- Every piece of data is organised like your plant (Plant › Line › Machine), with its history.
- You add a device with its register map, or give its PDF manual to an AI assistant such as Claude and it adds the device for you.
- Your charts and reports live in the tools you already know, Grafana or Power BI.
If you want to compare coppioT with building it by hand or with a low-code platform, it is in low-code or no-code IoT platform for industry.
We start with a short, fixed-price consultancy with engapplic: we review what is written down today, what data your equipment has and where to start. Then a pilot on one or two machines, and scaling to the rest of the plant. It is how we worked on the paint booth we have connected at a RACC-AXA workshop in Barcelona, with the integrator Sinnek.
All of that in days, not months: up to 90% faster than building it by hand.
Frequently asked questions
Is digitising the same as automating?
No. Automating means the machine does its job by itself, and its PLC takes care of that. Digitising data collection means reading what the machine already does, so you can see it, store it and analyse it. A highly automated plant can still be writing its data down on paper.
Do you have to change the machines or the PLC program?
Usually not. At most, the PLC’s communication is enabled or configured. Machines with no communication get a meter or a sensor added, without touching how they work.
What happens if the internet connection drops?
The gateway in the plant stores the data for about 1 or 2 days and sends it when the connection comes back.
Can we keep using Excel?
At first it is a good idea, in parallel, to compare. After that, reports come from the automatic data, in Grafana or Power BI, and the sheet is no longer needed for what is already read automatically.
Where do we start if we do not know what data we have?
With a review of the equipment: what each machine has, what communication and what data. That is what we do in the short consultancy, before connecting anything.
Still writing plant data down by hand? Request a demo: fill in the form, tell us what gets recorded today and on which machines, and we will show you how to read it automatically.
Acronyms
¹ PLC (Programmable Logic Controller): the controller that runs the machine; for example, a Siemens S7 or a Beckhoff.
² OPC UA (Open Platform Communications Unified Architecture): an industrial communication standard to read data from a PLC or other device securely, with its name and type.
³ OEE (Overall Equipment Effectiveness): a machine’s overall effectiveness, combining availability, performance and quality in a single percentage.
⁴ RS-485: a two-wire serial connection, very common in meters and industrial equipment.


