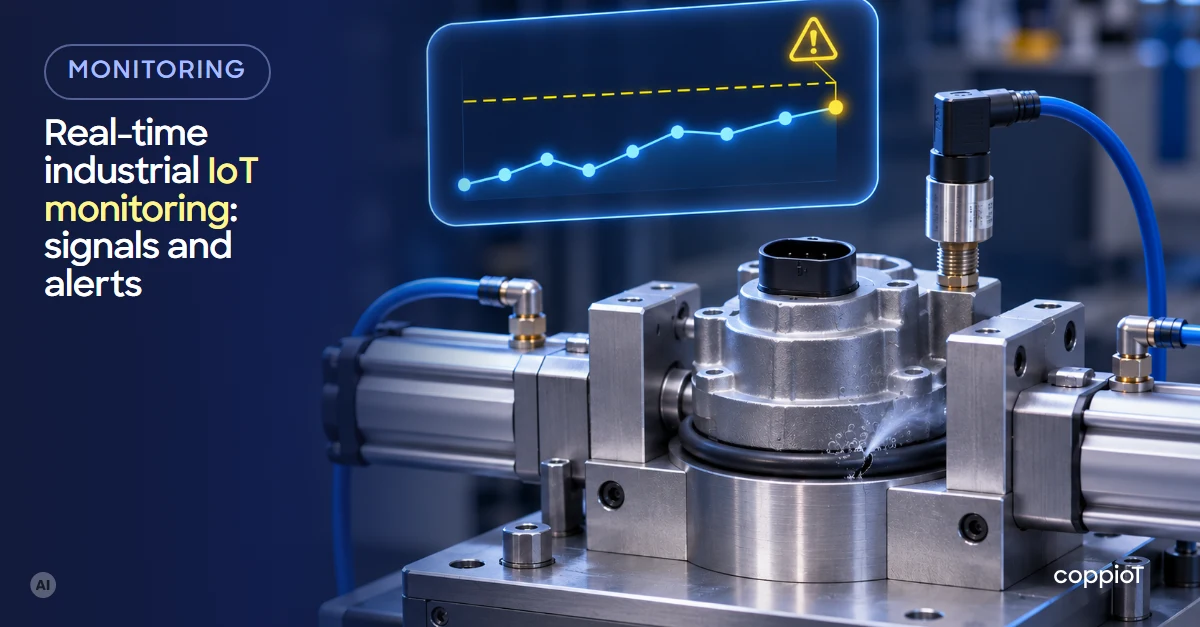
Real-time industrial IoT monitoring means seeing the state of your machines and process with data that updates every few seconds, keeping the history and getting an alert when something goes out of normal. It doesn’t replace the machine’s control, which stays in its PLC¹: what it adds is getting the information out of the control room and to the person who has to act, in time.
What is real-time industrial monitoring?
In many plants, what happened on a shift is known the next day: from the shift report, a spreadsheet or someone walking down to look. Real-time monitoring changes the order: each machine’s data arrives on its own, every few seconds, at a dashboard you can open from the office or your phone, and it is stored.
It’s worth not confusing it with two things many plants already have:
- The SCADA² or the machine’s screen: they show the process at that moment, in the control room or at the machine, and usually don’t keep the history or show trends.
- Remote access: a technician connects over a VPN³ when there’s a problem. It’s useful to fix one thing, but it leaves no continuous data to see what happened before the breakdown.
“Real time” here means seconds, not milliseconds. What is decided in milliseconds (stopping a motor, closing a valve) is still done by the PLC.
What can you monitor in a plant?
Almost any signal the machine already has, or that a sensor can measure. The most common ones:
| What you see | Where it comes from | What it’s for |
|---|---|---|
| Machine state (running, stopped, in alarm) | The PLC or a signal in the cabinet | Knowing what’s stopped right now and for how long |
| Good parts and rejects | The PLC’s counters | Output per shift and, together with the state, OEE⁴ |
| Temperature, pressure, flow, level | The PLC or sensors with a 4–20 mA output | Checking that the process stays within its range |
| Electricity, gas, compressed air | Power analysers and meters | Cost per part and what’s used without producing |
| Running hours, starts, vibration | PLC counters or sensors | Planning maintenance with data |
| Machine alarms | The PLC, and often the HMI⁵, which keeps the time of each one | What fails most and when |
Where to put the energy meters and how to read them is in energy monitoring in manufacturing.
The point is to start with a few signals: the ones that answer a specific question, like why this line stops or how much this oven uses. Measuring everything on day one fills dashboards nobody looks at.
How do industrial IoT alerts and alarm notifications work?
A dashboard only helps if someone is looking at it. Alerts work the other way round: the system gets the attention of the person who has to act. The most useful ones come in four types:
- Limit: a signal crosses a value. For example, the oil in a hydraulic unit that usually runs at 45–55 °C goes above 65 °C.
- State: a machine has been stopped for more than 10 minutes during production hours.
- No data: a device stops sending data. It’s usually a cable, a device switched off or the network, and it’s better to know at the time than to find a gap in the history a week later.
- Trend: the signal is still within its range but heading out of it. A motor that usually runs at about 60 °C and alarms at 80 °C reads 70, 71, 72 and 73 °C on consecutive days: nothing has gone off yet, but the chart says it will pass 80 in a week. A predictive maintenance system can alert you at that point, before the breakdown.
The figures are an illustrative example: every machine has its own ranges. To keep alerts from being ignored:
- Add a delay: the signal has to stay out of range for a while (for example, 5 minutes) before alerting, so a spike doesn’t trigger it.
- Give each one an owner: temperature alerts to maintenance, stoppages to the shift supervisor.
- Keep them few and reviewed: if an alert fires every day and nobody does anything, change the limit or remove it.
How do you set it up, step by step?
- Choose the questions and the signals: what you want to know, about which machines, and which signals answer it.
- Connect the machines: a gateway on the shop floor reads the PLC over OPC UA⁶ or Modbus⁷, and the sensors through analogue or pulse inputs. In most cases the machine’s logic doesn’t change. At most, the PLC’s communication is enabled or configured, or a few signals are wired in the cabinet. If the machines are old, there are several ways in; we cover them in how to connect legacy machines to the cloud.
- Organise the data like the plant: Plant › Line 2 › Press 3. That’s what lets you compare by line, by shift or between plants.
- Build the dashboard and the alerts: first an overview of what is running and what isn’t, then the detail for each machine.
- Review it after two or three weeks: with some history you can see which alerts are noise, which signal is missing and where time is lost.
If the internet connection drops, the gateway keeps the data for about 1 or 2 days and sends it when the connection is back.
Several plants on one dashboard
When each plant has its own system, comparing them is manual work. With all of them in the same data system and the same structure, management sees how each plant is doing on one screen, and each plant manager sees the detail of their own. The second plant is quicker to set up than the first: the signals, dashboards and alerts are already defined.
How we do it with coppioT
coppioT is engapplic’s no-code industrial IoT⁸ platform: it connects PLCs, sensors, energy analysers and other equipment of any brand to the cloud, in one data system and with no programming.
- A short consultancy at a fixed price, with engapplic: what you want to see, which machines you have and which signals are needed.
- A pilot on one or two machines: we connect them over OPC UA, Modbus RTU or TCP, analogue inputs or pulses, through a gateway whose installation files coppioT generates. coppioT is compatible with any PC or industrial PC; if you prefer, our gateway, available on request, comes with analogue inputs and a pulse counter.
- The dashboard and alerts in Grafana or Power BI, and then scaling to the rest of the plant.
That’s what we did on the paint booth we have connected at a RACC-AXA car workshop in Barcelona, with the integrator Sinnek: our gateway reads its pulses and analogue inputs, and the customer sees what the diesel or LPG⁹ and the electricity cost, and the cost per part and per hour.
All of that in days, not months: up to 90% faster than building it by hand.
Frequently asked questions
Is it the same as a SCADA?
No. A SCADA shows the process at that moment and lets you act on it from the control room, but it usually doesn’t keep the data or show trends. Cloud monitoring keeps the history and, from it, produces trends, indicators, costs and alerts, for any authorised person and from anywhere. The two can work side by side.
How often is the data updated?
Usually every few seconds. That’s enough to see states, output, temperatures and consumption; the machine’s fast control stays in the PLC.
Do you have to stop production to connect it?
To read a PLC that already has communication, no. Wiring signals in the cabinet or fitting a new sensor takes a few minutes per point, during a short stop or a shift change.
Is it safe to connect the machines to the internet?
It’s a fair concern. With coppioT the machines aren’t opened to the internet: the gateway only makes outbound connections and no inbound port has to be opened. We explain it in industrial IoT security.
Want to see your machines in real time? Ask for a demo: fill in the form, tell us which machines and PLCs you have and we’ll show you how it would look.
Acronyms
¹ PLC (Programmable Logic Controller): the controller that runs the machine; for example, a Siemens S7 or a Beckhoff.
² SCADA (Supervisory Control and Data Acquisition): a supervisory system that shows the process on screen and lets you act on it, usually from the control room.
³ VPN (Virtual Private Network): an encrypted connection to get into the plant’s network from outside.
⁴ OEE (Overall Equipment Effectiveness): availability, performance and quality combined into a single percentage.
⁵ HMI (Human-Machine Interface): the machine’s touch screen, where the operator runs it and sees its alarms.
⁶ OPC UA (Open Platform Communications Unified Architecture): an industrial communication standard to read data from a PLC or other device securely, with its name and type.
⁷ Modbus: a simple, widespread industrial protocol (RTU over a serial line, TCP over Ethernet). Data is read from numbered registers, following the map the device maker provides.
⁸ IoT (Internet of Things): industrial IoT (IIoT) connects machines and plant equipment to collect their data and use it.
⁹ LPG (Liquefied Petroleum Gas): propane or butane, a common fuel for burners and paint booths.


