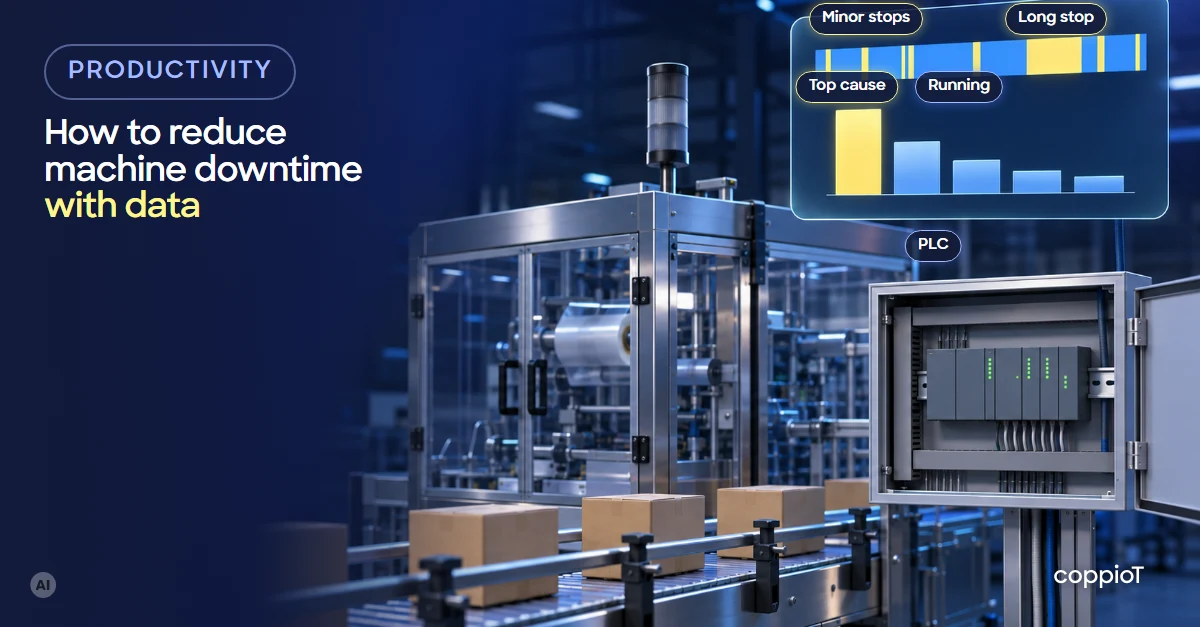
To reduce machine downtime, you first need to know how many stops there are, how long they last and why. With the PLC’s running signal connected, every stop is logged automatically, with its time, its duration and its alarm code, including the short stops nobody writes down. With that log you see which few causes take most of the downtime, tackle those first and check with the same data whether stops go down.
Why isn’t the downtime log sheet enough?
A log filled in by hand falls short in three ways:
- Short stops aren’t written down. A machine that stops for a minute twenty times a shift loses twenty minutes that appear on no sheet.
- Times are rounded. “Half an hour” can be twenty minutes or forty-five.
- The reason ends up as “other” or is written at the end of the shift, from memory.
With data like that, the cause that takes the most time may not be the one most talked about in the production meeting.
How do you log stops automatically?
The machine already knows when it’s stopped: its PLC¹ has a running or status signal and, if the stop comes from a fault, an alarm code. With the PLC connected, every stop is stored automatically: when it starts, when it ends, how long it lasts and which alarm was active. Nobody has to write anything down.
If the PLC also gives the machine’s mode (production, cleaning, changeover), planned stops are separated from unplanned ones. And if the machine has no PLC or it can’t be read, there are other ways to know whether it’s running, which we cover in how to calculate OEE in real time.
How the PLC’s data is read is explained in Modbus TCP vs OPC UA.
Which stops should you tackle first?
Sort the causes by total downtime, from most to least: that’s a Pareto chart. Almost always a few causes take most of the time. Tackle the first one and, once it drops, move on to the next.
Look at it by number of stops too. A two-hour breakdown gets noticed; forty one-minute stops a day don’t. The automatic log shows both, and sometimes the short stops add up to more time than the breakdown everyone talks about.
What are MTBF and MTTR?
They’re two indicators that come from the same log:
- MTBF² (mean time between failures): running time divided by the number of breakdowns. If it goes up, the machine fails less often.
- MTTR³ (mean time to restoration): total breakdown downtime divided by the number of breakdowns. If it goes down, the machine is back up sooner.
An example: in one week, a machine runs for 120 hours and has 4 breakdowns that add up to 6 hours stopped. Its MTBF is 30 hours (120 / 4) and its MTTR an hour and a half (6 / 4).
Calculated per machine and per cause, they tell you what to do. A falling MTBF for one cause is a breakdown that keeps coming back: look for its origin. A high MTTR can mean missing spare parts, a fault that’s hard to diagnose, or that nobody finds out about the stop until some time later. Both affect availability, one of the three factors of OEE⁴.
How do you get ahead of a failure?
Some failures give warning before they happen. A motor usually runs at about 60 °C and its alarm goes off above 80 °C. One day it reads 70 °C, the next 71, then 72, 73. No alarm has gone off, but the chart shows it will pass 80 °C in about a week.
With that trend in view, the inspection is scheduled during a planned stop, instead of waiting for the motor to stop the line. The same goes for a motor whose consumption rises for the same production, or a vibration that grows little by little. A predictive maintenance system can warn you about those trends; how it works is covered in predictive maintenance with IoT.
How do you make a stop shorter?
Part of the downtime is the time until someone finds out. If a machine has been stopped for more than a few minutes outside a planned break or changeover, an alert to the person in charge cuts that time. The alert has to reach someone who can act, and only when it’s needed; if it goes off for everything, people stop looking. How to set up alerts that get used is explained in real-time industrial monitoring.
How do you know downtime has gone down?
With the same data, before and after, and with similar production: downtime per week, number of stops, and the MTBF and MTTR of the cause you tackled. If you replaced the sensor that caused the short stops, the following week shows whether that cause has dropped off the Pareto chart.
How we do it with coppioT
coppioT is engapplic’s no-code industrial IoT⁵ platform: it connects PLCs, energy analysers, meters, controllers and other devices from several brands into a single data system, with no programming needed. The infrastructure is built on AWS, in the region you choose.
- Read the running signal and the alarms from the PLC you already have. Almost all modern PLCs support Modbus and OPC UA⁶, and in that case we recommend OPC UA. If your device uses another protocol, tell us and we’ll look at how to read it.
- Start with one machine or line and grow: first the one that stops most; then the rest.
- Your charts and reports, in the tools you already know: Grafana or Power BI, with the stops, the Pareto of causes, MTBF, MTTR and the alerts you need.
If you’re an integrator, you create one project per customer and see them all from the same coppioT; each customer logs into theirs and sees only their data.
We start with a short, fixed-price consultancy with engapplic, and a pilot before scaling. All of it in days, not months: up to 90% faster than building it by hand.
Frequently asked questions
What’s the difference between planned and unplanned downtime?
Planned downtime is known in advance: a changeover, a cleaning, scheduled maintenance or a break. Unplanned downtime comes without warning: a breakdown, a jam, missing material. Both count as time stopped, but unplanned stops are the ones to reduce; planned ones, at most, to shorten.
What is a minor stop?
A short stop, of seconds or a few minutes, that the operator fixes without calling maintenance: a badly placed part, a jam, a sensor that doesn’t detect. There’s no single limit; each plant sets its own, for example under five minutes. On their own they don’t look important, but added up they can be one of the machine’s biggest losses.
How much does an hour of downtime cost?
It depends on the machine, and you can work it out: the parts you don’t make in that hour times what you earn on each, plus the hours of the people waiting, the overtime to make up production and the parts scrapped when restarting. With the downtime log you know how many hours a month that is, and from which cause.
Can you know why a machine stopped without anyone writing it down?
For stops that raise an alarm, yes: the PLC’s alarm code is stored with the stop. Stops with no alarm, such as waiting for material or for quality approval, need someone to give the reason.
Want to know how long your machines stop and why? Ask for a demo: fill in the form, tell us which machines and PLCs you have and we’ll show you how to see their stops.
Acronyms
¹ PLC (Programmable Logic Controller): the controller that runs a machine or an installation.
² MTBF (Mean Time Between Failures): running time divided by the number of breakdowns. The IEC vocabulary defines it as the expected operating time between failures, for items that are repaired (IEC 60050-192, term 192-05-13).
³ MTTR (Mean Time To Restoration): total breakdown downtime divided by the number of breakdowns. The IEC defines it as the expected time until the item works again, and deprecates the older name mean time to repair (IEC 60050-192, term 192-07-23). Both definitions can be read free on Electropedia, the IEC’s online vocabulary: type the term number in its search box.
⁴ OEE (Overall Equipment Effectiveness): combines availability, performance and quality.
⁵ IoT (Internet of Things): here, industrial equipment that sends its data to the cloud.
⁶ OPC UA (Open Platform Communications Unified Architecture): an industrial communication standard for reading data from a PLC or other device securely.


